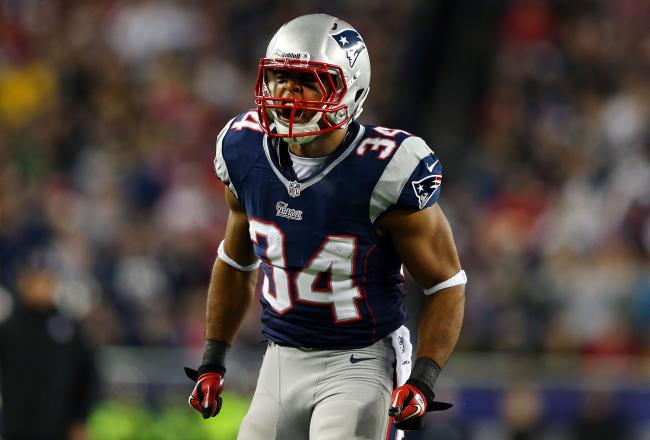
Shawn Siegele of Rotoviz and Pro Football Focus has a pretty genius way of evaluating how good running backs are at moving with the ball; he deemed the statistic ‘vision yards’. The stat is simply a players total yards per carry, subtracting their yards per rush after contact. The premise is simple: the longer it takes for a running back to actually get hit, the more laterally agile and explosive they are.
Seems true enough. Given all of the news coming out of the Patriots camp about Julian Edelman and Gronkowski going on the PUP list as we enter training camp, I think that it is becoming exceedingly clear that the Patriots are going to be forced into a more traditional, run-first offense. What makes this situation so fascinating from a fantasy perspective is that the Patriots have such a fast paced offense that there are more carries to be had then the typical 18-20 for a lead back, with some scraps for the backups. Shane Vereen absolutely is going to play a larger role in the offense in 2013, but we can’t forget that before an injury shortened his season, Brandon Bolden accrued 56 carries playing behind Stevan Ridley. While much of the attention to back up running backs possibly having flex value in 2013 has focused on Chip Kelly in the Eagles, it isn’t unfathomable to me that Ridley, Vereen and Bolden could all have value at the same time. Given that Ridley has shown a weakness at securing the football, it also isn’t unreasonable to think that a “Denver in 2012 after McGahee went down” scenario could occur if Ridley is benched or hurt; in that scenario, Vereen’s role would stay the same and Bolden would fill in for an injured Ridely.
Using vision yards and a simple stat labeled Missed Tackle % (total runs divided by missed tackles. Rough sketch of how often a player makes a defender miss) and explosion score, I wanted to get a better idea of how these 3 runners compared to one another in lateral agility and competing against NFL defenders.
| Name | Att. | Avg. | Vision Yards | YCo / Att. | MT | Missed Tackle % | Explosion Score |
| Brandon Bolden | 56 | 4.9 | 2 | 2.9 | 10 | 17.86% | 11.4 |
| Stevan Ridley | 290 | 4.4 | 1.9 | 2.5 | 29 | 10.00% | 10.99 |
| Shane Vereen | 62 | 4 | 1.9 | 2.1 | 4 | 6.45% | 11.23 |
Stats Courtesty of PFF
I was not expecting Ridley’s explosion score to be so good or Brandon Bolden’s vision yards and missed tackle % to be so good. Given the small sample size of Bolden’s 2012, I think it’s probably okay to wipe that away as a possible aberration. Vereen and Ridley were very similar, except that Ridley performed better after contact. Again, small sample size caveats, but the 3 players certainly look like Belichick knows what he has and has typecast them into their roles well. For those wondering why LaGarrete Blount wasn’t included, I only planned on using players who are going to make the final 53.

You must log in to post a comment.